
Bitcoin dominance reached 59% this September, proving that even in a $2.6 trillion market, the heavy hitters still dictate the rhythm. In this high-velocity environment, tracking thousands of speculative assets is a recipe for exhaustion and missed opportunities. You need a streamlined way to monitor the top 20 crypto prices live without the distraction of market noise. Most traders struggle with delayed data that causes them to miss critical entry points; it's a frustrating reality that often separates retail participants from institutional-grade results.
This guide provides the precise, real-time data required to make informed decisions in the 2026 landscape. We've filtered the chaos to focus on the assets that form the bedrock of the digital economy. You'll get a clear view of the performance of the leading 20 assets, from Bitcoin's $79,392 valuation to Ethereum's recent outperformance at $2,501. We also analyze the strategic shifts driving these numbers, including the $986.9 million in recent ETF inflows and the upcoming CLARITY Act vote. It's time to replace market chatter with actionable intelligence.
Key Takeaways
- Understand why the top 20 assets function as the "Blue Chip" index of the digital economy; they represent the vast majority of total market capitalization.
- Learn why monitoring the top 20 crypto prices live via low-latency feeds is essential for preventing costly delays during volatile market shifts.
- Master a two-step strategic tracking method to determine global market direction and identify profitable sector rotations before they trend.
- Discover why circulating supply is a more accurate metric than total supply when evaluating the true valuation of high-volume assets.
- Find out how integrating live price alerts with expert daily recaps can filter out market noise and streamline your decision-making process.
Why Monitoring the Top 20 Cryptocurrencies is Essential in 2026
The digital asset market has expanded into a sprawling ecosystem of thousands of tokens. While there is a comprehensive list of cryptocurrencies available, the vast majority lack the structural integrity required for institutional capital. The top 20 assets function as the "Blue Chip" index of this world. They are the bedrock. Monitoring the top 20 crypto prices live allows you to filter out the noise of micro-cap volatility. This focus leads to a more disciplined and professional strategy. You don't need to track every speculative move; you need to understand the leaders.
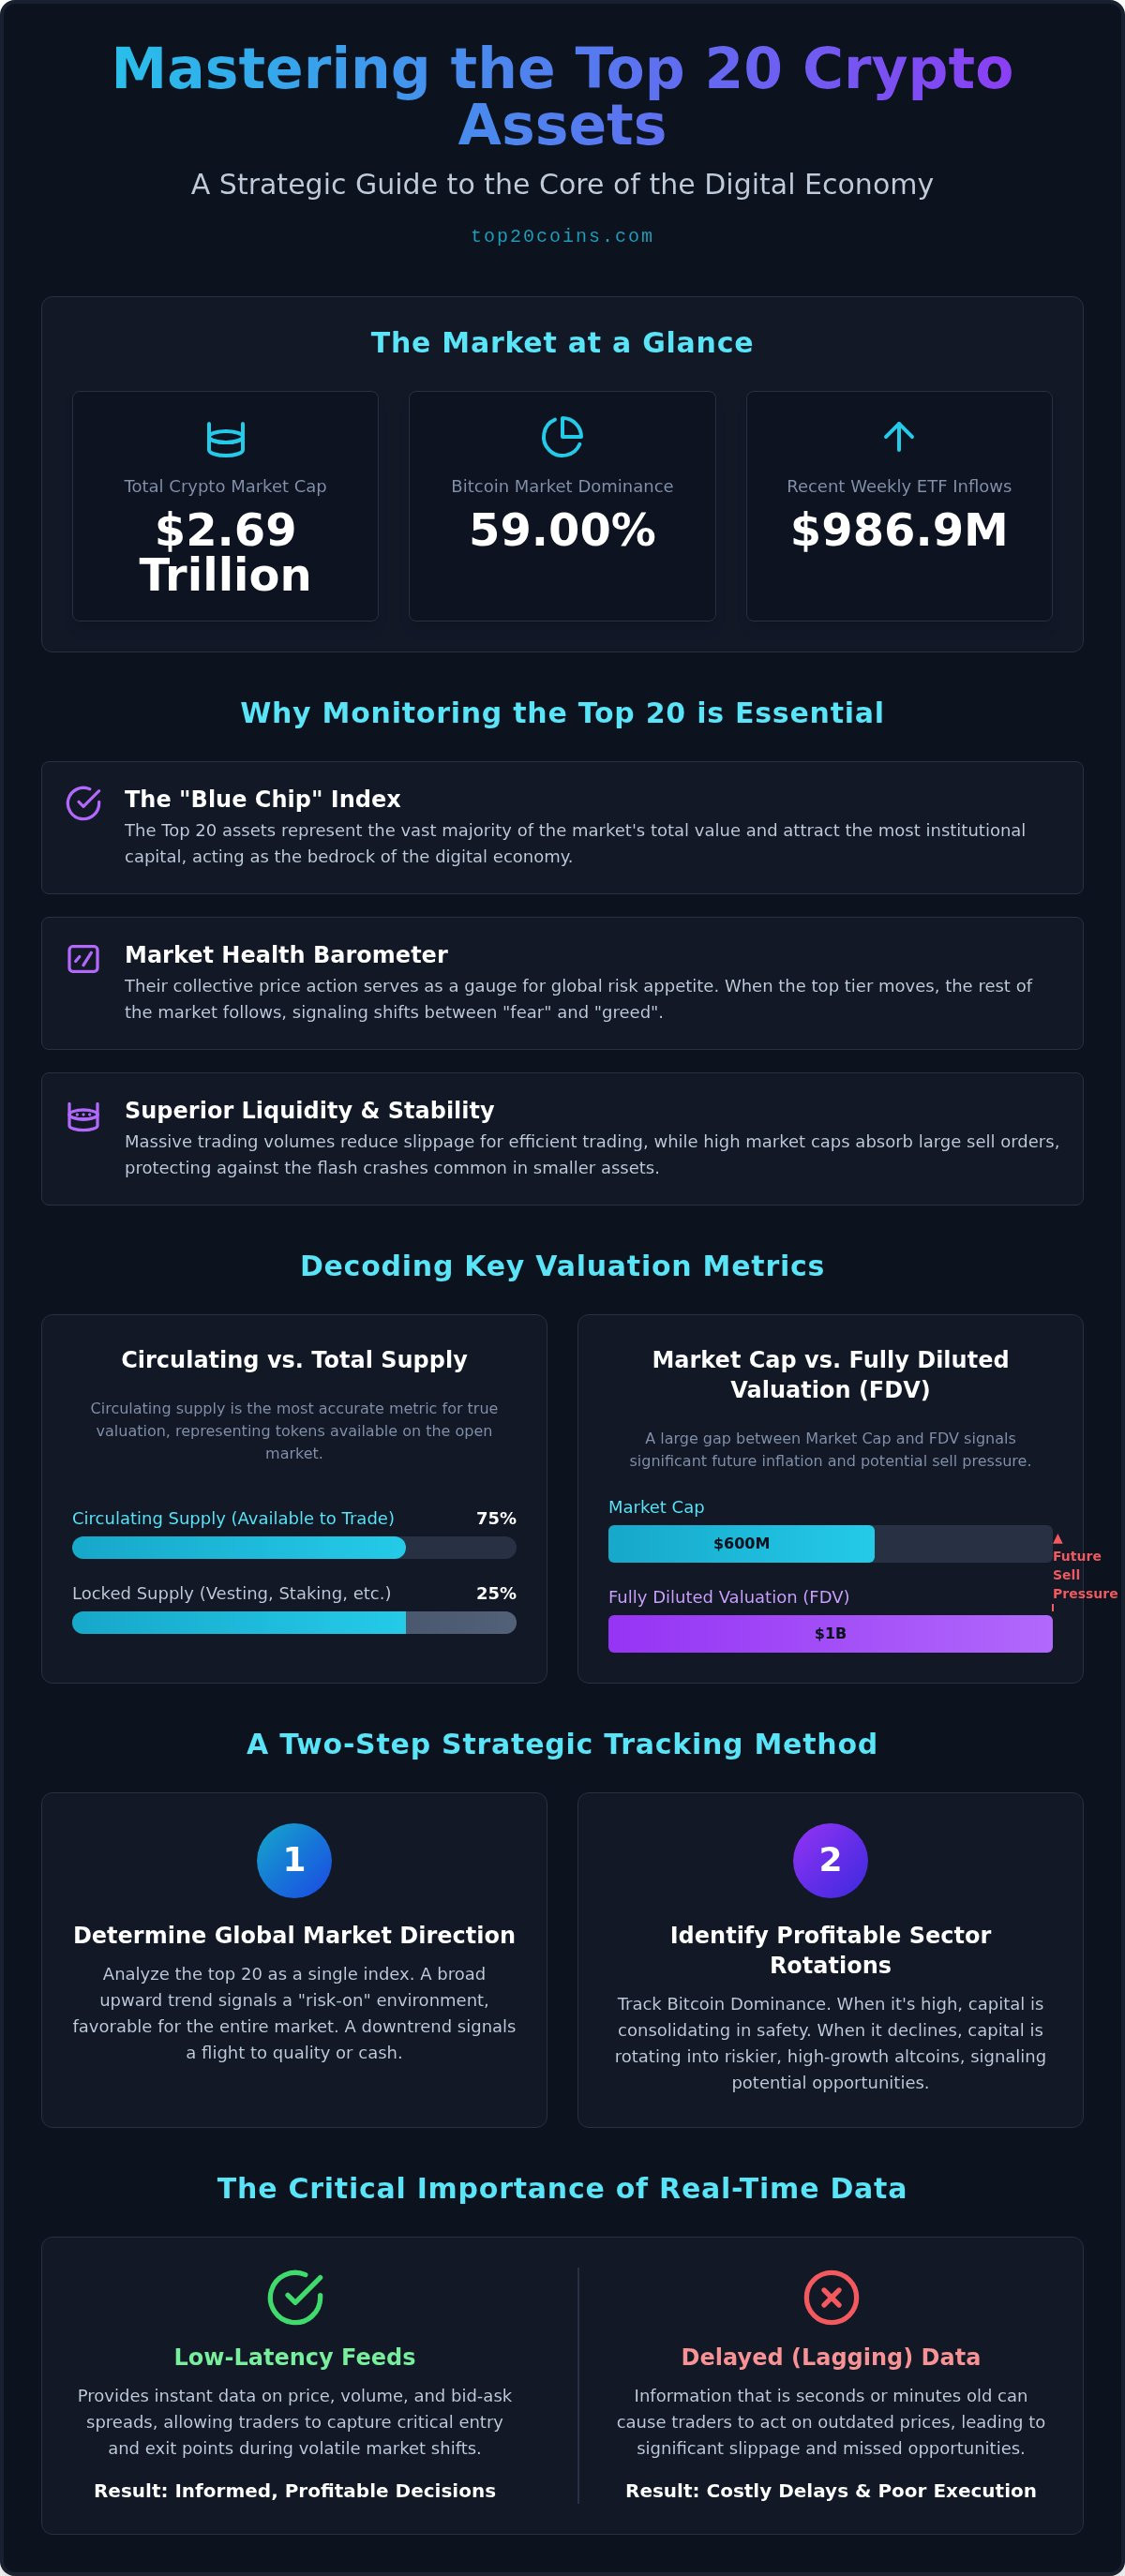
As of September 2026, the total crypto market cap stands at approximately $2.69 trillion. The top 20 coins represent the overwhelming majority of this value. These are the primary targets for corporate treasuries and the surging ETF market. Recent data shows massive institutional interest: Bitcoin ETFs saw $986.9 million in weekly inflows, while Ethereum and XRP ETFs continue to attract significant capital. Regulatory clarity is also centering on this group. The upcoming Senate vote on the CLARITY Act could reclassify certain assets as commodities, potentially triggering even larger institutional inflows into the top tier.
The Top 20 as a Market Health Indicator
These assets act as a barometer for global risk appetite. When the top tier moves, the rest of the market eventually reacts. They serve as a "fear and greed" gauge for the entire industry. Market Dominance is the ratio of an individual asset's market capitalization to the total value of all digital assets, a metric currently led by Bitcoin at 59.00%. High dominance often precedes a flight to quality, while a declining ratio suggests capital is rotating into riskier, high-growth altcoins.
Liquidity and Stability in the Top Tier
Liquidity is the lifeblood of efficient trading. The top 20 assets maintain massive trading volumes across global exchanges, which significantly reduces slippage. In a fast-moving 2026 market, low slippage ensures you enter and exit positions at prices close to the top 20 crypto prices live ticker. These coins offer a layer of protection against the "flash crashes" common in low-liquidity assets. Higher market caps act as a buffer. They absorb large sell orders without the catastrophic price collapses seen in speculative tokens. This stability makes them the preferred choice for those prioritizing capital preservation alongside growth.
Understanding Live Price Data: Market Cap, Volume, and Volatility
A live price ticker is more than a scrolling number. It's a real-time snapshot of global market sentiment. When you monitor the top 20 crypto prices live, you're viewing the intersection of three critical metrics: the last price, the 24-hour percentage change, and the bid-ask spread. The spread is particularly vital; it represents the difference between the highest price a buyer will pay and the lowest price a seller will accept. Narrow spreads indicate high liquidity, a hallmark of the top 20 assets that ensures efficient trade execution.
Market capitalization remains the primary ranking metric for these assets. It's calculated by multiplying the current price by the circulating supply. It's vital to distinguish this from total supply. Circulating supply represents the tokens actually available for trade in the open market. In 2026, assets with large portions of their supply still locked can create artificial scarcity. This leads to significant crypto market risks, as sudden token unlocks can flood the market and suppress prices. Interpreting the daily "highs" and "lows" within this context helps you identify the range where an asset is finding its equilibrium.
Market Cap vs. Fully Diluted Valuation (FDV)
Fully Diluted Valuation (FDV) is the market cap if every possible token were in circulation. In 2026, a high FDV relative to market cap is a major warning sign for investors. It suggests future sell pressure from team or investor vesting schedules. Professional traders use FDV to identify "inflationary" coins that may struggle to maintain their rank. A massive gap between these two numbers often creates a hard price ceiling: it's harder for a coin to double in price if billions of dollars in new supply are scheduled to enter the market. You can access our live tracker to compare these metrics side-by-side for the leading assets.
Volume as a Catalyst for Price Action
Trading volume confirms the strength of any price movement. A price surge on low volume is often a "bull trap" that quickly reverses. Conversely, a spike in volume during a breakout usually signals institutional entry and trend confirmation. In 2026, distinguishing "Real Volume" from "Wash Trading" is essential for accurate analysis. We look for exchange-specific volume to see where the largest market participants, or "whales," are positioning. High volume at established support levels often precedes a major trend reversal, providing a strategic entry point before the broader market reacts to the top 20 crypto prices live data.
Real-Time vs. Lagging Data: The Cost of Delayed Information
Speed is the primary currency of the 2026 digital asset market. For serious participants, the technical distinction between "Live" and "Lagging" data is often the difference between profit and liquidation. Most standard platforms rely on REST API feeds, which pull data at set intervals. This creates a staggered, fragmented view of the market. In contrast, professional-grade systems utilize WebSockets; this technology maintains a persistent, open connection that pushes data the millisecond a trade occurs. When you monitor the top 20 crypto prices live, you're interacting with a stream of intelligence that bypasses the latency inherent in traditional web requests.
A 30-second delay might seem negligible in traditional finance, but it's an eternity during a crypto breakout. In a market where Bitcoin can fluctuate by hundreds of dollars in seconds, relying on stale information is a high-risk strategy. Relying on a single exchange also introduces systemic risk. If a major platform experiences a localized liquidity crunch or a technical glitch, its price may deviate significantly from the rest of the market. Top20Coins mitigates this by aggregating data from dozens of global sources to produce a "Global Median Price." This approach ensures that a single outlier doesn't distort your market view.
The Architecture of Accuracy
We leverage programmatic data networks to deliver sub-second updates across the board. Our infrastructure includes a rigorous data cleansing layer. This process automatically identifies and removes outlier prices from illiquid exchanges that don't reflect true market value. Median price aggregation is superior to single-source data because it neutralizes the impact of localized volatility and exchange-specific manipulation. It provides a stabilized baseline for making high-stakes decisions in a volatile environment.
Price Discrepancies and Arbitrage
Bitcoin prices rarely match exactly across different global exchanges. These discrepancies occur due to varying levels of supply, demand, and regional liquidity. For instance, the "Kimchi Premium" in South Korea often sees assets trading at a significant markup compared to Western markets. While some traders use our top 20 crypto prices live tracker to identify arbitrage opportunities, executing these trades requires sophisticated tools and an understanding of regional transfer regulations. Always verify the "Global Average" to ensure you aren't overpaying due to a localized price spike on your preferred platform.
Strategic Tracking: How to Analyze Top 20 Price Action Today
Successful market participation requires moving beyond passive observation. To extract value, you need a methodical framework. Start by checking the Global Market Cap; this tells you the overall market direction and current capital inflow. Next, identify the Top Gainers and Top Losers within the index. This reveals where liquidity is currently clustering. When you monitor the top 20 crypto prices live, look for patterns where capital moves from established leaders into high-growth ecosystems.
Analyzing the relationship between price and news is critical for distinguishing a sustainable trend from a temporary spike. We suggest following this structured approach:
- Step 1: Check the Global Market Cap to establish the broad market trend.
- Step 2: Scan the Top Gainers and Losers to find active sector rotations.
- Step 3: Review Bitcoin Dominance to assess the risk-on or risk-off environment.
- Step 4: Cross-reference price action with real-time analysis to validate the move.
- Step 5: Configure Price Alerts for psychological milestones like Bitcoin at $150,000.
Identifying Sector Rotations
Capital often follows a predictable path. It typically starts with Bitcoin gains before flowing into the Top 10, then trickling down to the rest of the Top 20. This "Wealth Effect" creates opportunities to spot emerging trends before they saturate. For instance, you might see money rotate from Layer 1 blockchains like Ethereum and Solana into AI-centric assets within the top tier. Monitoring which ecosystems lead the daily charts helps you position yourself before the rotation completes.
The Role of Sentiment in Live Prices
Market Sentiment acts as the primary driver for retail FOMO in 2026. Data-centric traders use the Fear & Greed Index alongside top 20 crypto prices live updates to identify overextended conditions. A social sentiment spike often acts as a leading indicator; it signals high engagement before the actual price breakout. When greed levels hit extremes, it suggests a local top, while extreme fear can present a strategic entry point for those focused on institutional-grade assets.
Leverage the Top20Coins Ecosystem for Smarter Decisions
Raw data is a tool; intelligence is the strategy. Our platform bridges the gap between seeing the top 20 crypto prices live and understanding the catalysts behind them. We've built an ecosystem where real-time tracking integrates seamlessly with institutional-grade analysis. This ensures you aren't just watching numbers flicker on a screen. You're observing the execution of a global financial shift. By combining our live data feeds with deep-dive market recaps, you can transition from reactive trading to proactive positioning.
Our infrastructure includes specialized features designed for the 2026 market. The "Comparison Tool" allows you to benchmark the performance of the top 20 assets against traditional benchmarks like Gold or the S&P 500. This provides a macro perspective on capital flight and asset class rotation. Additionally, our Price Alerts function as your digital sentry. You can set custom triggers for specific price points or percentage moves, ensuring you never miss a breakout because of a 30-second data lag. It's about maintaining a continuous stream of intelligence that matches the pace of the industry.
The Crypto Alpha Advantage
Data alone can lead to information overload. The Crypto Alpha Newsletter solves this by acting as a sophisticated filter for the noise. More than 50,000 investors rely on our daily recaps to understand the "why" behind the "what." Our analysts strip away the speculative chatter to deliver the three most significant market moves of the day. We provide the "Alpha" that raw tickers can't: the underlying narrative of institutional adoption and ecosystem growth. It's a concise, data-backed brief that respects your time and prioritizes accuracy. Subscribe to the Crypto Alpha Newsletter to start receiving professional-grade market recaps directly in your inbox.
Customizing Your Live Tracker Experience
Efficiency is the hallmark of a professional trader. Our interface allows you to strip away irrelevant data and focus on the metrics that drive your specific strategy. You can use advanced filters to sort by 24-hour volume, market cap, or volatility scores. Saving your favorite assets creates a personalized "Live Dashboard," allowing for a focused view of the tokens you actually trade. This structured approach prevents the distraction of tracking 10,000+ irrelevant coins. Focus on the market leaders; they dictate the trend. View the Top 20 Crypto Prices Live Now and take control of your market perspective.
Mastering the 2026 Digital Asset Market
The 2026 market rewards precision and punishes hesitation. By focusing on the institutional bedrock of the industry, you move beyond speculative noise and into a realm of strategic clarity. You've learned that the top 20 assets act as the primary barometer for global liquidity, where sub-second data accuracy is the only way to navigate high-volatility breakouts effectively. Relying on median price aggregation and real-time WebSockets ensures your decisions are based on the most accurate top 20 crypto prices live data available.
Success in this ecosystem requires more than just raw numbers; it demands a synthesis of live tracking and expert analysis. Top20Coins provides this institutional-grade intelligence through our curated news feeds and the Crypto Alpha Newsletter. Join over 50,000 professional investors who prioritize clarity over chaos. It's time to refine your strategy and leverage tools built for the future of finance. Track the Top 20 Crypto Prices Live on Top20Coins and stay ahead of the next major market rotation. Your path to professional-grade market mastery starts with the right data.
Frequently Asked Questions
How often do the top 20 crypto prices update on Top20Coins?
Top20Coins utilizes advanced WebSockets technology to deliver sub-second refresh rates for all assets. This ensures you're viewing the top 20 crypto prices live without the lag associated with traditional REST APIs. In the high-frequency environment of 2026, even a few seconds of delay can lead to poor execution. Our infrastructure maintains a persistent connection to global data networks, pushing price changes to your dashboard the moment they occur on primary exchanges.
Why is it better to track only the top 20 cryptocurrencies?
Focusing on the top 20 assets provides a sophisticated filter for market noise. These coins represent the "Blue Chip" index of the digital economy, capturing the vast majority of total market capitalization and institutional interest. While thousands of speculative tokens exist, the top 20 offer superior liquidity and stability. This curated approach allows you to ignore low-cap volatility and focus on the assets that dictate broad market trends and attract significant ETF inflows.
What is the most accurate way to calculate a coin’s market cap in 2026?
The most accurate calculation remains the current market price multiplied by the circulating supply. While some platforms emphasize Fully Diluted Valuation, circulating supply is the only metric that reflects tokens currently available for trade. In 2026, it's critical to account for verified on-chain data to ensure supply figures haven't been distorted by unvested tokens or locked reserves. This formula provides a realistic baseline for evaluating an asset's true market footprint and strategic significance.
Can I set price alerts for all top 20 coins for free?
You can configure custom Price Alerts for all top 20 assets at no cost. Our system allows you to set specific price targets or percentage-based triggers to stay informed of sudden market shifts. These alerts help mitigate the risks of data lag, delivering notifications via your preferred channel the moment a target is hit. It's a professional-grade tool designed to ensure you never miss a critical breakout or support level breach during volatile periods.
What is the difference between circulating supply and total supply?
Circulating supply refers to the number of tokens currently in the hands of the public and available for trading. Total supply includes these coins plus any tokens that are locked, reserved, or not yet in distribution. Understanding this difference is vital for identifying potential sell pressure. In 2026, coins with a low circulating supply relative to their total supply often face inflationary risks as new tokens enter the market and dilute existing value.
How does Bitcoin dominance affect the prices of the other top 19 coins?
Bitcoin dominance measures BTC's share of the total market cap and acts as a risk barometer for the other top 19 coins. When dominance rises, capital typically flows into the safety of Bitcoin, often causing altcoin prices to stagnate. Conversely, a drop in dominance often signals "Altseason," where investors rotate profits into higher-growth assets within the Top 20. Tracking this ratio helps you determine if the market is in a "risk-on" or "risk-off" phase.
Is the live price data on Top20Coins pulled from a single exchange?
No, we don't rely on a single exchange. Top20Coins aggregates data from dozens of global trading platforms to calculate a "Global Median Price." This method is more robust than single-source data because it filters out localized price spikes and exchange-specific liquidity issues. By cleansing outlier data from illiquid sources, we provide a stabilized view of the top 20 crypto prices live, ensuring your analysis is based on broad market consensus rather than isolated volatility.
How can I use the Crypto Alpha Newsletter to improve my trading?
The Crypto Alpha Newsletter provides high-value intelligence by distilling complex market movements into daily recaps. Instead of sifting through endless charts, you receive the three most significant moves and the strategic "why" behind them. Our analysts act as a sophisticated filter, identifying institutional shifts and ecosystem rotations that raw data might miss. It's an efficient way to gain a competitive edge by understanding the narratives driving the top 20 assets every day.