
Most traders lose their edge because they have too much data, not too little. In a market where Bitcoin dominance sits at 59.03%, watching thousands of micro-cap tokens is often a distraction from where the real capital is moving. To find clarity, you need cryptocurrency price charts live that prioritize the Top 20 assets. This institutional-grade focus filters the static; it allows you to see if a 5% spike in Solana or a move in the $77,913 Bitcoin range is a genuine breakout or just a momentary ripple in a sea of $72.94 billion daily volume.
You likely feel the frustration of free trackers that lag during high volatility or the confusion of seeing conflicting signals across a dozen different coins. We understand that in 2026, speed and precision are the only metrics that matter. This guide promises to transform how you interact with market data. You will master the art of reading live charts to identify high-conviction trends while ignoring the noise that traps retail investors. We will analyze the essential chart patterns for the current cycle, show you how to monitor the Top 20 moves with precision, and help you build a reliable workflow that keeps you ahead of the next major market shift.
Key Takeaways
- Understand the transition from legacy retail visuals to institutional-grade data feeds that provide sub-second updates for professional-level precision.
- Learn to decode the anatomy of a candlestick by mastering OHLC data and selecting the correct timeframe for your specific investment goals.
- Discover why monitoring cryptocurrency price charts live for the top 20 digital assets is the most efficient way to capture the majority of market value.
- Gain a strategic edge by identifying primary trends and mapping critical support and resistance levels to filter out temporary market noise.
- Build a reliable monitoring workflow using real-time price alerts and curated insights to react faster than the broader market.
The Evolution of Live Cryptocurrency Price Charts in 2026
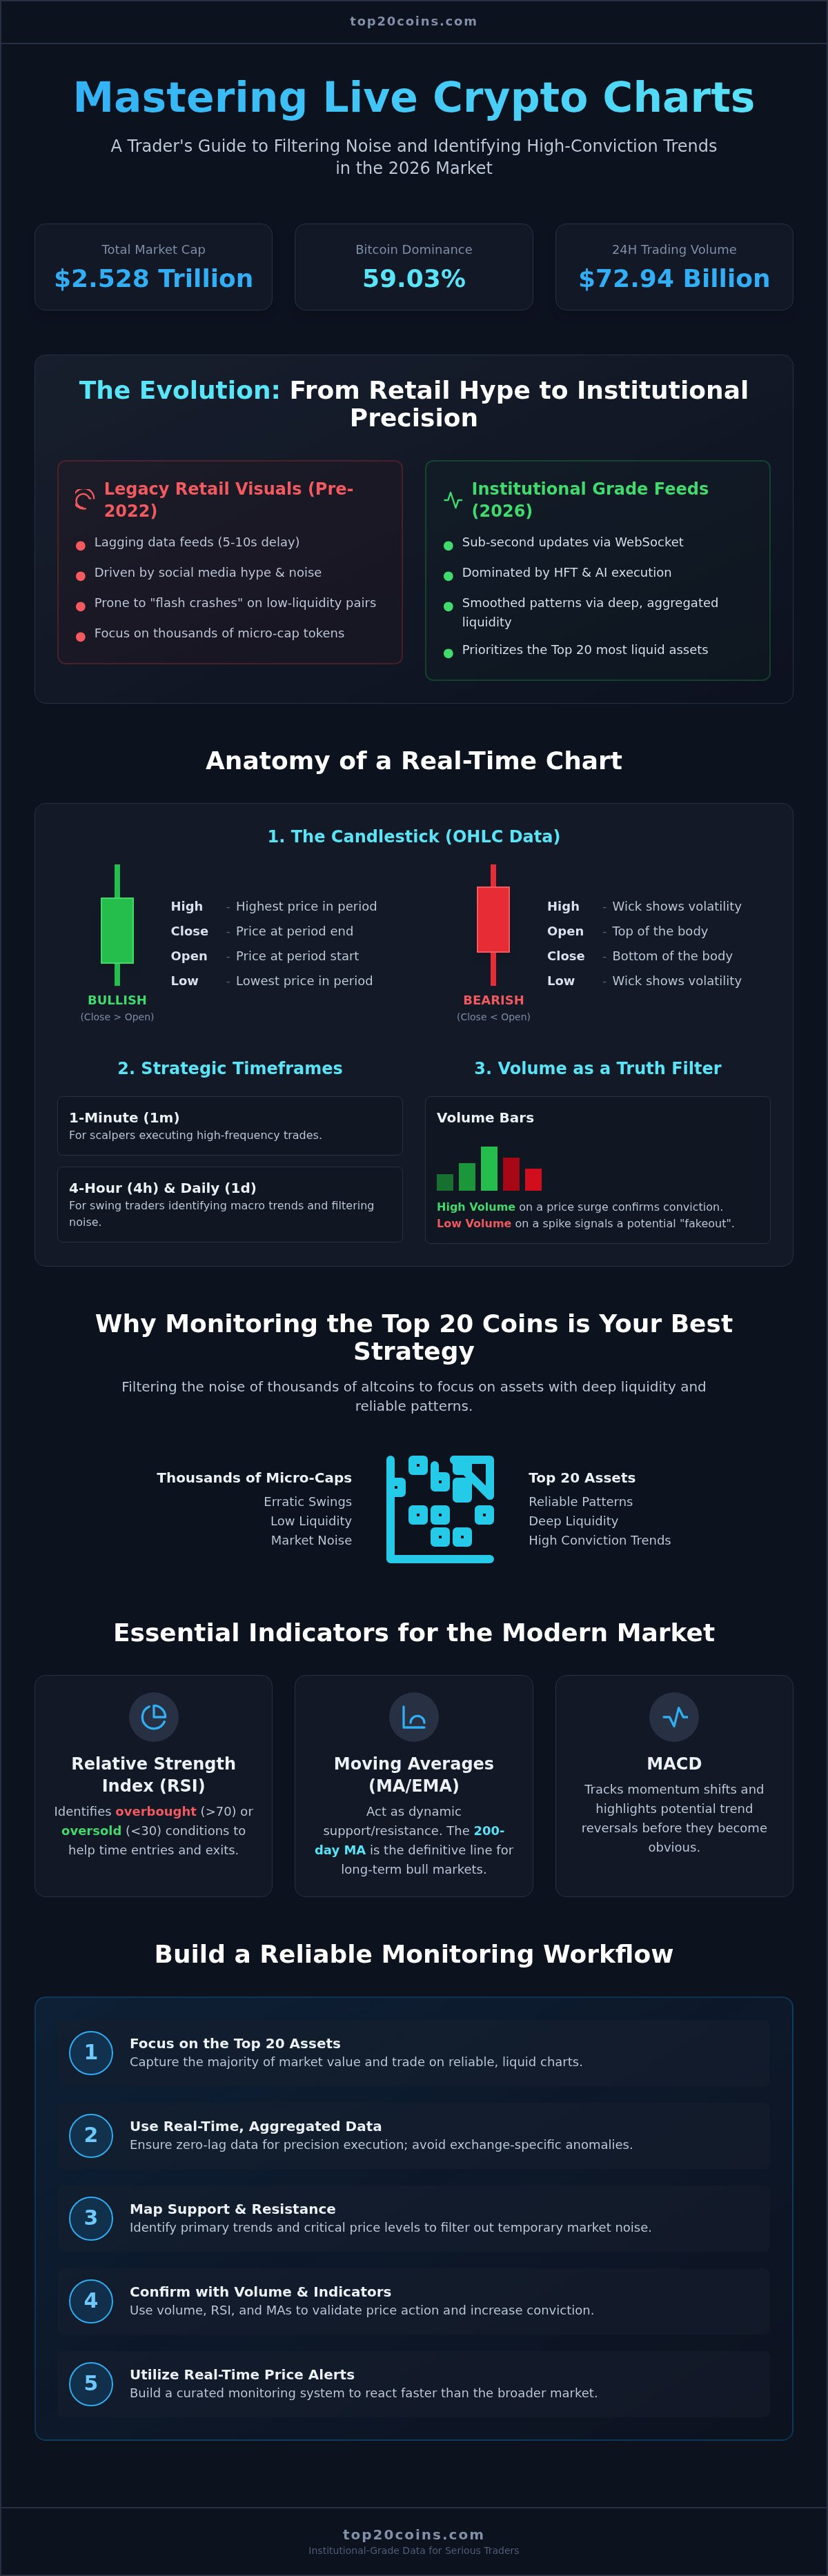
Live crypto charts are the pulse of the digital economy. They provide visual representations of price action updated in sub-second intervals; this precision is vital for navigating a total market capitalization that now exceeds $2.528 trillion. In the previous market cycle of 2021, retail-driven hype often dictated chart movements. By 2026, the landscape has fundamentally shifted. Institutional-grade data feeds now dominate the ecosystem, replacing the erratic swings of the past with sophisticated, high-frequency liquidity.
The necessity of cryptocurrency price charts live has intensified due to the prevalence of High-Frequency Trading (HFT) and AI-driven execution. These systems process market shifts in milliseconds. If you are viewing data that refreshes every ten seconds, you are essentially looking at history. Before mastering technical analysis, a foundational step involves understanding cryptocurrency and its decentralized nature; this knowledge helps investors distinguish between exchange-specific anomalies and broader market trends. Relying on a single exchange feed is risky. Aggregated market data provides a neutral, comprehensive view of an asset's true value across all major liquidity pools.
Real-Time Data vs. Lagging Indicators
Latency is the silent killer of portfolio gains. In the volatile 2026 market, a five-second delay can be the difference between a profitable exit and a trapped position. Modern platforms utilize WebSocket technology to maintain a persistent, bi-directional connection between the server and your screen. This ensures that live price tickers reflect the exact moment a trade occurs. Top20Coins prioritizes this zero-lag architecture for major assets. We ensure that our users see the same data used by institutional desks, allowing for precise decision-making when Bitcoin dominance shifts or Ethereum experiences a sudden surge in volume.
Understanding Market Liquidity and Chart Accuracy
Not all charts are created equal. High-volume assets within the Top 20 produce the most reliable technical patterns because they possess deep liquidity. This depth prevents "ghost" price movements: artificial spikes caused by a single large order on a low-liquidity exchange. The 2026 market has matured significantly. Institutional adoption has smoothed out the historical "flash crashes" that once plagued the industry. By focusing on cryptocurrency price charts live for the Top 20, investors can trust that the support and resistance levels they identify are backed by billions in actual trading volume rather than speculative noise.
Anatomy of a Real-Time Chart: Key Components for Investors
A real-time chart is a high-resolution snapshot of market sentiment and capital flow. To master cryptocurrency price charts live, you must first deconstruct the candlestick. Each bar represents four critical data points: Open, High, Low, and Close (OHLC). Learning how to read crypto charts starts with these fundamentals. The solid "body" shows the range between the opening and closing prices; the "wicks" reveal the volatility peaks and troughs hit during that specific window.
Timeframes dictate your strategic lens. Scalpers operate on 1-minute (1m) intervals to harvest micro-fluctuations driven by high-frequency algorithms. Conversely, swing traders rely on 4-hour (4h) or daily (1d) charts to filter out intraday noise and identify high-conviction macro trends. Choosing the wrong timeframe is a common mistake that leads to overtrading and unnecessary losses.
Volume bars at the bottom of the chart serve as your ultimate truth filter. High volume during a price surge confirms institutional conviction. Low volume during a spike often signals a "fakeout" where the price is likely to revert. To look deeper, professional investors analyze order book depth. This visualizes the "buy walls" and "sell walls" where massive limit orders sit, providing a map of where the market is likely to find immediate support or resistance.
Technical Indicators for the Modern Market
Indicators provide a mathematical overlay to raw price action. The Relative Strength Index (RSI) identifies when an asset is overbought or oversold, helping you avoid buying at a local top. Moving Averages (MA and EMA) act as dynamic support; the 200-day line remains the definitive "line in the sand" for bull markets. Finally, the MACD tracks momentum shifts, often highlighting a trend reversal before it hits the mainstream news cycle.
Customizing Your Live View
Efficiency defines the successful trader. Setting up a multi-chart layout allows you to monitor the Top 20 coins simultaneously, spotting instant correlations between Bitcoin and the broader market. Most professionals utilize dark mode and high-contrast visuals to maintain focus during 24/7 monitoring. Integrating news overlays directly onto your cryptocurrency price charts live ensures you see the "why" behind a price move as it happens. For a streamlined experience that strips away exchange-side clutter, a live cryptocurrency price tracker provides the essential data required for high-level market curation.
Why Monitoring the Top 20 Coins is Your Best Strategy
The cryptocurrency market operates on a power-law distribution. While thousands of digital tokens exist, the Top 20 assets command the overwhelming majority of the $2.528 trillion total market capitalization. Monitoring cryptocurrency price charts live for these specific coins provides a high-fidelity view of the ecosystem's health. It effectively eliminates the distraction of micro-cap volatility. By narrowing your focus, you align your strategy with where the actual capital resides.
Market capitalization is a more reliable metric than social media hype. While a trending token might see a temporary 100% gain, it often lacks the structural support found in established assets. A review of the Top 10 Cryptocurrencies shows that these projects have weathered multiple cycles and regulatory shifts. This stability makes their chart patterns more predictable and their support levels more meaningful for technical analysis. Focusing on these rankings acts as a natural filter for long-term portfolio stability.
Bitcoin dominance currently stands at 59.03%. This figure is not just a statistic; it is a strategic directive. BTC price action serves as the primary engine for the entire Top 20. When Bitcoin consolidates, liquidity often flows into high-cap altcoins. When Bitcoin breaks down, the broader market typically follows with increased velocity. Understanding this hierarchy is essential for anyone using cryptocurrency price charts live to time their entries.
The Correlation Factor: BTC, ETH, and the Top 20
Altcoins generally mirror Bitcoin's movements but with higher beta. Ethereum acts as a secondary leader, serving as a proxy for the DeFi and Layer 2 sectors. Professional traders look for "decoupling" events. This happens when a Top 20 asset moves against the general market trend. Spotting these shifts on live charts allows you to identify organic strength before the mainstream news cycle catches up. It's the difference between chasing a pump and identifying a trend.
Institutional Liquidity in the Top 20
Institutional capital is highly selective. ETFs and global hedge funds prioritize liquidity and regulatory compliance, which restricts their activity to the largest market caps. This influx of professional money creates massive "buy walls" that sustain price floors. Unlike micro-caps, Top 20 coins are largely immune to "pump and dump" schemes. Their high trading volume ensures that price moves are backed by genuine market participation rather than low-volume manipulation.
How to Read Live Charts to Identify Market Trends
Trend identification is the primary objective for any market participant. When analyzing cryptocurrency price charts live, you must first determine the market's trajectory: uptrend, downtrend, or sideways. Professional analysts achieve this by mapping support and resistance zones on higher timeframes, such as the 4-hour or daily intervals. These levels act as psychological floors and ceilings where price action historically stalls or reverses. Once these zones are established, the next step is seeking "confluence." This occurs when multiple indicators, such as the RSI and MACD, align with price action at a critical level, increasing the probability of a successful trade.
Volume serves as the ultimate validator. In 2026, the total 24-hour trading volume averages $72.94 billion; any significant price move lacking proportional volume is often a speculative trap. Institutional backing is visible when high-volume bars accompany a breakout. Finally, you must monitor external catalysts. Regulatory shifts, such as the pending "CLARITY Act" vote or SEC proposals, can instantly invalidate technical patterns. A chart might look bullish, but an unexpected news event will always override the geometry of the candles.
Spotting Bullish vs. Bearish Reversals
Reversal patterns signal the exhaustion of a current trend. The "Double Bottom" remains a reliable bullish indicator for 2026, suggesting that sellers have failed to push the price below a specific floor twice. Conversely, the "Head and Shoulders" pattern warns of a bearish shift. During a rally, "Bull Flags" help identify brief consolidation periods that offer safe entry points before the next leg up. It's vital to distinguish these from "Dead Cat Bounces." These are temporary price recoveries in a falling market that lack volume support and lure unsuspecting investors into trap positions.
The Role of Sentiment Analysis
Technical data is only half the equation. Market sentiment often dictates the velocity of a move. The current Fear & Greed Index sits at 71, indicating a state of "Greed." This suggests the market may be approaching an overheated phase where a correction is probable. Social media spikes frequently precede live chart breakouts as retail interest builds momentum. By using a live cryptocurrency price tracker, you can contextualize sudden price drops with integrated news analysis. This allows you to determine if a dip is a fundamental shift or a simple liquidity grab by institutional players. For those looking to stay ahead, our Crypto Alpha Newsletter provides the strategic intelligence needed to filter this noise effectively.
Maximizing Your Market Edge with Top20Coins
Top20Coins serves as the essential filter for a market that never sleeps. While exchanges prioritize transaction fees and high-frequency churn, our platform focuses on institutional-grade intelligence and data clarity. Accessing cryptocurrency price charts live through a neutral aggregator allows you to observe the market without the inherent bias of a trading desk. We provide a clean, ad-supported interface that delivers professional-grade data feeds for the Top 20 assets; this ensures you spend less time fighting a cluttered UI and more time identifying high-conviction trends.
The global nature of digital assets means volatility can strike at any hour. Our 24/7 market coverage spans every major liquidity pool, giving you a worldwide scope that exchange-specific trackers often lack. By centralizing real-time rankings and integrated news, we provide the strategic guide you need to navigate the $2.528 trillion ecosystem with precision.
Your Daily Market Workflow
Success in 2026 requires a methodical approach to data consumption. An efficient morning routine begins by reviewing the Top 20 rankings to identify overnight leaders and laggards. You should immediately check the 24-hour trading volume, which currently averages $72.94 billion, to determine if current price action has the necessary momentum to sustain itself. Setting up custom Price Alerts is the next critical step. Instead of staring at cryptocurrency price charts live all day, set threshold alerts for major support and resistance levels. This allows you to step away from the screen, knowing you'll be notified the moment a Top 20 breakout occurs. Finally, our daily recaps help you filter the previous day's noise, allowing you to focus on the significant shifts that actually impact your portfolio.
Staying Ahead with the Alpha Newsletter
In the 2026 market, "Alpha" represents information that the broader public hasn't fully priced in yet. While charts tell you what is happening, our Crypto Alpha Newsletter explains the "why" behind the movement. We connect technical chart patterns to macro-economic trends, such as the implications of the "Regulation Crypto Assets" proposal or shifts in Bitcoin dominance. This intelligence acts as a sophisticated filter; it transforms raw data into actionable insights. To ensure you stay ahead of the next major market rotation, Subscribe to the Crypto Alpha Newsletter for daily market insights. By combining live price tracking with deep-dive analysis, you move from being a reactive observer to a proactive market participant.
Mastering the 2026 Market Cycle
Navigating the 2026 digital asset landscape requires more than just access to data; it demands a hierarchy of intelligence. By prioritizing the Top 20 market leaders, you filter out the speculative noise that often traps retail traders. Success in this environment depends on your ability to synthesize technical confluence with real-time catalysts. You now have the framework to decode candlestick patterns, monitor liquidity walls, and execute a disciplined daily workflow.
Utilizing cryptocurrency price charts live provides the sub-second precision necessary to compete with institutional algorithms. This methodical approach ensures your decisions are backed by volume and institutional conviction rather than fleeting hype. It's time to elevate your strategy with tools designed for accuracy and speed. Access real-time institutional-grade data feeds and comprehensive analysis of the Top 20 market leaders today.
Stay ahead of the curve by joining our ecosystem and receiving the free daily Crypto Alpha newsletter for tactical market insights. Your journey toward professional-grade market curation starts here. The tools are ready; the data is live. It's your move.
Track the Top 20 Crypto Prices Live Now
Frequently Asked Questions
What is the best timeframe for live cryptocurrency price charts?
The ideal timeframe depends on your specific strategy; scalpers use 1-minute charts while swing traders prefer the 4-hour or daily view. Short timeframes capture micro-volatility but often contain excessive noise. Higher timeframes reveal the macro trend and institutional support levels. For most investors, the 1-hour chart provides a balanced perspective for intraday moves without the frantic pace of sub-minute updates. Consistency across multiple timeframes is key to confirming a genuine breakout.
Why do different websites show different live prices for the same coin?
Prices vary across platforms because each exchange operates its own independent order book where supply and demand meet. A live cryptocurrency price tracker that aggregates data from multiple sources provides a more accurate global average than a single exchange feed. Arbitrage traders typically close these gaps quickly, but slight discrepancies persist due to varying liquidity levels and trading fees across different global jurisdictions. Aggregated data minimizes the risk of making decisions based on isolated anomalies.
Can I use live charts to predict future crypto prices?
Live charts don't predict the future with absolute certainty, but they do identify high-probability patterns based on historical human behavior. Technical analysis uses these visual cues to map potential support and resistance zones. While indicators like RSI or MACD suggest momentum shifts, external catalysts such as regulatory changes or macro-economic shifts can instantly invalidate any chart pattern. Charts are tools for risk management and timing rather than crystal balls for price guarantees.
What are the most important technical indicators for beginners?
Beginners should start with the Relative Strength Index (RSI) and simple Moving Averages. The RSI helps identify if an asset is overbought or oversold, preventing entries at local peaks. Moving Averages, specifically the 50-day and 200-day lines, provide a clear visual of the primary trend direction. Volume is another essential metric; it confirms if a price move has real market conviction or is simply a low-liquidity spike destined for a reversal.
Is there a free app for real-time crypto price alerts?
Top20Coins offers free Price Alerts that notify users of significant market movements without the need for a paid subscription. You can set custom thresholds for the top 20 digital assets to ensure you never miss a critical breakout or breakdown. This service allows you to monitor the market passively while maintaining a professional edge. Our Crypto Alpha Newsletter also provides daily context, helping you understand the fundamental drivers behind the alerts you receive.
What does "Bitcoin Dominance" mean on a live chart?
Bitcoin Dominance represents the percentage of the total cryptocurrency market capitalization held by BTC, which currently stands at 59.03%. On cryptocurrency price charts live, a rising dominance usually indicates capital is flowing into the safety of Bitcoin. Conversely, a falling dominance suggests that investors are shifting their capital into altcoins. Tracking this metric helps you determine whether the current market environment favors the market leader or the broader Top 20 assets.
How does trading volume affect live price action?
Trading volume acts as the fuel for any price movement; it validates the strength of a trend. High volume during an uptrend suggests institutional conviction and suggests the move has staying power. If the price rises on low volume, it often indicates a lack of buyer interest and a potential "fakeout." With a total 24-hour trading volume of $72.94 billion, monitoring these spikes helps you distinguish between genuine breakouts and temporary retail hype.
Why should I focus on the Top 20 coins instead of new launches?
Focusing on the Top 20 coins provides a level of liquidity and stability that new launches lack. These established assets represent the vast majority of the $2.528 trillion market cap and are less susceptible to "pump and dump" manipulation. While new coins offer high-risk potential, the Top 20 provide more reliable technical patterns for analysis. Narrowing your focus to market leaders reduces information overload and helps you identify trends with institutional backing.

