
Bitcoin's 24.8 percent surge in a single week this September ranks among the top 1 percent of weekly gains recorded since 2020. This explosive move highlights why understanding major cryptocurrency price changes is now a requirement for any serious market participant. Most investors still find themselves paralyzed by conflicting headlines or drowning in information overload during sudden volatility. It's difficult to identify the specific catalyst behind a price drop when the noise of the 24-hour news cycle obscures the data.
We've designed this guide to help you master the mechanics behind market volatility and interpret significant shifts in the top 20 digital assets. You'll gain a professional framework for evaluating price movements that moves beyond speculative chatter. We'll examine the direct link between macroeconomic news, such as the upcoming CLARITY Act Senate vote, and real-time market volatility. By the end of this analysis, you'll possess the ability to use data tools effectively to filter noise and act on high-value intelligence.
Key Takeaways
- Identify the specific catalysts behind market volatility by linking institutional liquidity shifts to real-time price action.
- Distinguish between sustainable growth and deceptive rallies by evaluating the relationship between trading volume and major cryptocurrency price changes.
- Establish a methodical framework for monitoring the Top 20 assets to filter out speculative noise. It's the most efficient way to prioritize high-impact movements.
- Utilize live tracking data and strategic newsletters to identify emerging trends before they reach mainstream saturation.
- Master the "risk-on" dynamics that link traditional financial markets to digital asset performance in the 2026 ecosystem.
What Drives Major Cryptocurrency Price Changes?
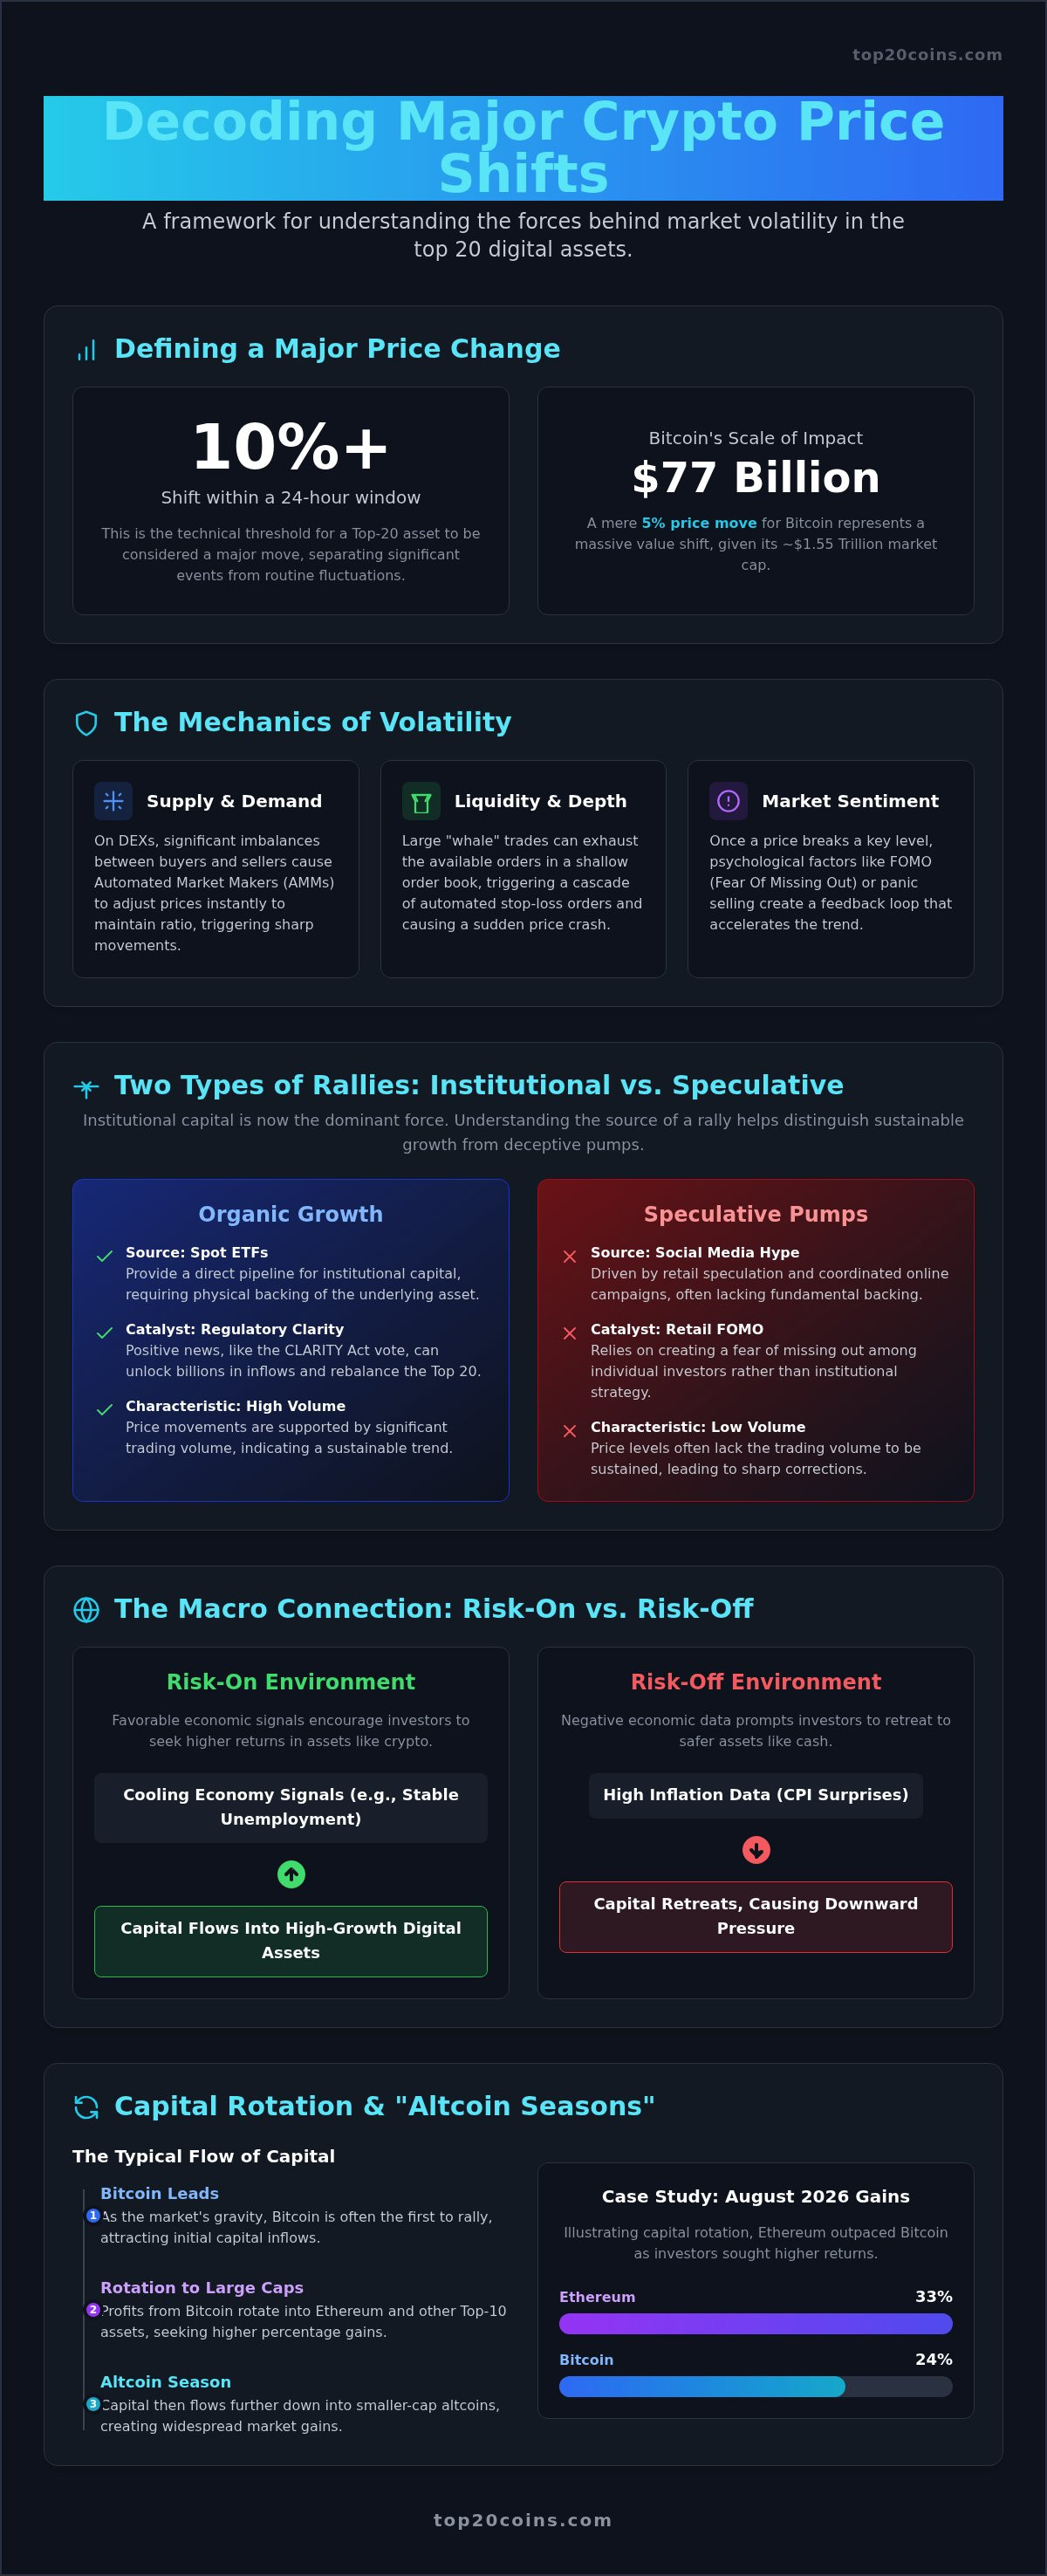
Price action in the 2026 digital asset market isn't driven by retail speculation alone. A major cryptocurrency price change is technically defined by its impact on the asset's market structure; usually a double-digit percentage shift within a 24-hour window for a Top 20 asset. While Bitcoin's market cap sits at roughly $1.55 trillion, a 5 percent move represents a massive $77 billion shift in value. This scale is vastly different from low-cap altcoins where thin liquidity allows for erratic, low-volume swings. Understanding what cryptocurrency is and how its underlying volatility functions is essential for any modern portfolio.
Supply and demand mechanics in decentralized exchanges (DEXs) provide the raw data for these movements. Unlike centralized counterparts, DEXs rely on automated market makers. When a significant imbalance occurs between buyers and sellers, the price adjusts instantly to maintain the ratio. In the Top 20, these shifts are usually the result of fundamental news or institutional rebalancing rather than random retail noise. Sentiment acts as the final propellant. Once a price breaks a key technical level, the psychological fear of missing out (FOMO) or panic selling creates a feedback loop that accelerates the trend.
Liquidity and Market Depth
Liquidity is the lifeblood of price stability. Market depth is the ability of a market to sustain large orders without price movement. For assets like Ethereum or Solana, deep order books on major global exchanges absorb most trades without causing a ripple. However, "whale" trades, transactions involving thousands of units, can still pierce through this depth if they're executed poorly. When a whale dumps a significant position into a shallow order book, it triggers a cascade of stop-loss orders. This chain reaction is a primary cause of major cryptocurrency price changes that seem to happen in a vacuum.
Institutional Catalysts in 2026
Institutional capital is now the dominant force in the market. The total cryptocurrency market cap rose by 17.6 percent to $2.70 trillion in September 2026, largely due to "rates trades" influenced by Federal Reserve policy. Spot ETFs provide a direct pipeline for this capital. These products create organic growth because they require the physical backing of the underlying asset. In contrast, speculative pumps are often driven by social media hype and lack the volume to sustain their new price levels. Regulatory clarity, specifically the upcoming Senate vote on the CLARITY Act, serves as a massive catalyst. Positive news regarding such legislation can unlock billions in institutional inflows, shifting the rankings of the Top 20 assets overnight.
The Impact of Macro Trends on Digital Asset Prices
Digital assets no longer exist in a vacuum. By September 2026, the market rally became widely recognized as a "rates trade," heavily influenced by Federal Reserve interest rate decisions and US Treasury policy. When the US unemployment rate held at 4.1 percent in August, it signaled a cooling economy that often triggers a shift in investor appetite. Understanding major cryptocurrency price changes requires looking at the broader financial horizon. In a risk-on environment, capital flows from traditional bonds into high-growth assets like the Top 20 coins. Conversely, when inflation data (CPI) surprises to the upside, investors often retreat to cash, causing immediate downward pressure on Bitcoin and Ethereum.
The correlation between traditional finance and digital assets has tightened. Institutional desks now treat Bitcoin as a high-beta version of the Nasdaq. However, this isn't a perfect mirror. While macro triggers like CPI data cause initial ripples, crypto-native factors often dictate the recovery's strength. Geopolitical instability frequently reinforces the "digital gold" narrative, positioning Bitcoin as a hedge against sovereign currency debasement. Spot Bitcoin ETFs saw net outflows of $4.83 billion earlier in 2026, yet the August recovery proved that institutional demand remains resilient. To stay ahead of these macro shifts, savvy traders use real-time price alerts to catch moves the moment the data drops.
Bitcoin Dominance and Market Cycles
Bitcoin remains the market's gravity. When its price shifts, the rest of the Top 20 typically follows. This relationship is best understood through Bitcoin market dominance live: Impact on the Top 20. During "Altcoin Seasons," capital rotates from Bitcoin into Ethereum and Solana, leading to higher percentage gains for the latter. In August 2026, Ethereum's nearly 33 percent gain outpaced Bitcoin's 24 percent surge, illustrating how dominance shifts can amplify returns in specific sectors. This rotation is a methodical process. It starts with Bitcoin leading the rally, followed by a secondary move in large-cap assets as investors seek higher risk-adjusted returns.
Network Upgrades and Protocol Shifts
Technical milestones are powerful volatility drivers. The "buy the rumor, sell the news" phenomenon is a staple of crypto price action. Investors accumulate assets ahead of major network upgrades, such as the Ethereum 2026 protocol shifts, only to liquidate once the update is live. Analyzing historical major cryptocurrency price changes around these technical milestones reveals a pattern of front-run accumulation followed by tactical profit-taking. These protocol shifts often change the fundamental utility of the coin. If an upgrade improves transaction throughput or reduces fees, the long-term price floor usually rises, even if a short-term "sell the news" event occurs. Monitoring these milestones is critical for distinguishing between speculative noise and structural growth.
Analyzing the Data: Gainers, Losers, and Volume
Raw percentage change is a deceptive metric. Many investors focus solely on the "Top Gainers" list, failing to realize that a 20 percent spike often lacks structural support. In the 2026 market, where the total capitalization sits at roughly $2.63 trillion, the context of a move is more important than the number itself. Understanding major cryptocurrency price changes requires a deep dive into the underlying data. A move must be validated by liquidity. Without significant trading volume, a rally is simply a temporary imbalance that often leads to a "dead cat bounce." This occurs when an asset in a long-term downtrend sees a brief, low-volume recovery before continuing its decline. Contextualizing these shifts through market cap rankings allows you to see the hierarchy of impact across the Top 20.
Volume vs. Price Action
Volume represents the conviction of market participants. High-volume price shifts indicate institutional accumulation or distribution, while low-volume moves often stem from "wash trading" or retail noise. Learning how to use a cryptocurrency price ticker live is the most efficient way to spot these volume spikes in real time. A price increase on low volume is often a bearish signal because it suggests a lack of conviction among buyers. When volume doesn't confirm the price trend, the move is likely unsustainable. In contrast, when a Top 20 asset breaks a resistance level on massive volume, it signals a high-probability trend continuation that demands institutional attention.
Deciphering the Top 20 Movers
The volatility profile of the Top 20 is not uniform. Stablecoins like Tether (USDT) should ideally show zero percentage change; any deviation indicates a liquidity stress event or a de-pegging risk. Utility tokens like Solana (SOL) or BNB exhibit much higher beta. It's critical to understand scale: a 5 percent move in Bitcoin, which commands a $1.55 trillion market cap, requires billions in capital inflow. This move carries more weight for the global ecosystem than a 20 percent pump in a micro-cap asset. Tracking major cryptocurrency price changes across this hierarchy helps you identify the "flippening" potential of assets like Ethereum. By monitoring real-time data, you can see if Ethereum is gaining ground on Bitcoin's dominance or if the market leader is reasserting its control over the cycle.
How to Monitor Major Price Changes Effectively
Monitoring major cryptocurrency price changes effectively requires a shift from reactive to proactive behavior. Professional market participants don't wait for a headline to break; they build a system that alerts them when the data shifts. This methodical approach ensures you're acting on intelligence rather than emotion. By following a structured process, you can filter the noise that typically leads to information overload.
- Step 1: Set baseline price alerts for the Top 20 assets. Distinguish between specific price targets and rapid percentage shifts to catch volatility as it happens.
- Step 2: Filter market noise by focusing on high-volume movers. If an asset spikes on negligible volume, it's a distraction that lacks institutional support.
- Step 3: Cross-reference price action with real-time news analysis. Confirm if a move is driven by a fundamental catalyst, like a Senate vote, or a simple technical liquidity sweep.
- Step 4: Use a data aggregator to view the market holistically. Seeing how a Bitcoin move impacts Ethereum and Solana in real time provides essential context.
- Step 5: Avoid emotional "revenge trading" during flash crashes. Flash crashes in 2026 have proven that panic leads to liquidation. Data is your only hedge against market volatility.
Setting Professional Price Alerts
Automation is the only way to scale your market awareness. While "price hit" alerts are useful for entry points, "percentage change" alerts are the gold standard for detecting volatility. Most institutional snapshots rely on 24-hour change data to identify emerging trends. The Top20Coins alert system simplifies this process by delivering real-time notifications directly to your device. This allows you to step away from the screen without missing a pivotal market shift.
Utilizing Price Aggregators
Holistic visibility is critical for identifying capital rotation patterns. A top 20 crypto prices live dashboard provides an immediate snapshot of market health. Real-time charts allow for instant trend identification; they show whether a move is an isolated event or part of a broader sector rally. Historical context is equally vital. Comparing today's price to the weekly average helps determine if a change is a structural breakout or a mean reversion. To begin building your own data-driven monitoring system, access our live cryptocurrency price tracker today.
Leveraging Top20Coins for Real-Time Market Intelligence
Identifying major cryptocurrency price changes requires more than a scrolling feed of numbers. It demands a curated view of the assets that actually dictate global market direction. Top20Coins prioritizes accuracy in price aggregation to ensure retail investors have access to the same institutional-grade intelligence as professional trading desks. Our live tracker strips away the noise of thousands of low-liquidity tokens; it focuses instead on the Top 20 assets that represent the core of the $2.63 trillion global market cap. By simplifying complex data into actionable metrics, we help you filter out the speculative chatter that often leads to poor decision-making.
Accuracy is our top priority because we understand that even a minor lag in data can result in missed opportunities or unnecessary losses. In a market where Bitcoin can surge 24.8 percent in a single week, real-time updates aren't a luxury; they're a requirement. Our platform acts as a sophisticated filter for market noise, presenting a no-nonsense expert view that values your time. We don't just show you that a price moved. We provide the infrastructure to help you understand the strategic significance of that movement within the broader digital ecosystem.
The Top20Coins Advantage
Most data platforms overwhelm users with irrelevant information. We focus exclusively on the 20 assets that move the needle. This concentration allows us to provide deeper insights into market cap rankings and volume tracking without the clutter. Our clean, ad-supported interface ensures that high-level data remains free for all users. Integration is key; our platform connects live price action with real-time news analysis. This provides the "why" behind every shift, whether it's a regulatory update like the CLARITY Act or a sudden shift in US Treasury policy. You're not just watching a ticker; you're observing a continuous stream of structured intelligence.
Your Daily Crypto Workflow
A disciplined market participant starts their day with a methodical overview. Begin by checking the total market cap and 24-hour volume metrics to gauge the overall "risk-on" or "risk-off" appetite. Next, identify the "Daily Movers" within the Top 20. This allows you to spot capital rotation patterns, such as money moving from Bitcoin into high-beta utility tokens like Solana. Cross-reference these major cryptocurrency price changes with our integrated news feed to confirm the catalyst. This structured rhythm helps you avoid emotional trades during flash crashes and keeps you focused on sustainable trends. For those who require a deeper dive, our weekly analysis provides the context needed to navigate the 2026 market with confidence.
Subscribe to the Crypto Alpha Newsletter for exclusive market insights and master the mechanics of the digital asset economy.
Mastering the 2026 Market Volatility
Navigating the digital asset landscape requires a transition from speculative guesswork to a data-backed strategy. We've explored how institutional liquidity and macro triggers, such as Federal Reserve policy and the CLARITY Act, now dictate the rhythm of the Top 20 assets. It's clear that major cryptocurrency price changes are rarely random. They're the result of specific protocol shifts or global economic catalysts that demand professional analysis. Success in this environment depends on your ability to verify volume and market depth before acting on a trend. By focusing exclusively on high-impact assets, you can filter out the noise and prioritize high-value intelligence.
Staying ahead of the 2026 market means having access to institutional-grade reporting. Our platform provides the essential tools for this mission, featuring live 24/7 market data and real-time volume and market cap tracking. With an exclusive focus on the Top 20, you'll always have the most relevant snapshots at your fingertips. Track the Top 20 Crypto Prices Live Now to ensure your decisions are grounded in accuracy. The market's complexity is a significant opportunity for those equipped with the right data. Take control of your market analysis and trade with the confidence of an insider.
Frequently Asked Questions
What causes a sudden 10% drop in major cryptocurrency prices?
Sudden 10 percent drops usually stem from massive liquidity liquidations or unexpected macroeconomic shocks. In 2026, the market is highly sensitive to Federal Reserve interest rate pivots and regulatory updates like the CLARITY Act. When a large "whale" sells a significant position into a shallow order book, it triggers a cascade of automated stop-loss orders. This rapid chain reaction creates a temporary supply imbalance that forces the price down until it finds a new support level.
How often do the Top 20 cryptocurrency rankings change?
Top 20 rankings change constantly as market caps fluctuate based on real-time price action and circulating supply. While the top three assets like Bitcoin and Ethereum remain relatively stable, the lower half of the Top 20 is highly competitive. Projects focused on Decentralized Finance (DeFi) or AI-related tokens often shift positions weekly. Major cryptocurrency price changes in these mid-cap assets can trigger a re-ranking within minutes during periods of high volatility.
Is a high percentage price change always a good sign?
No, a high percentage change can be a deceptive metric if it lacks sufficient trading volume. A "pump" on low volume often indicates a lack of institutional conviction and typically precedes a sharp correction. Professional traders look for "organic" growth, where price increases are backed by high liquidity and sustainable demand. If a price spikes 20 percent without a fundamental news catalyst, it's often a speculative move that creates a high risk of a "dead cat bounce."
Why do all cryptocurrencies seem to move with Bitcoin?
Bitcoin acts as the primary source of liquidity and market sentiment for the entire digital asset ecosystem. Most altcoins are traded against Bitcoin in pairs, meaning its price shifts directly impact their valuation. Additionally, institutional investors often treat the Top 20 as a single asset class. When Bitcoin's price surges, it signals a "risk-on" environment that attracts capital into Ethereum, Solana, and other large-cap assets, creating a synchronized market movement.
How can I track real-time price changes for free?
You can monitor the market using our live cryptocurrency price tracker, which provides 24/7 data for the most significant digital assets. Our platform aggregates real-time metrics, including market cap and 24-hour volume, without requiring a paid subscription. For deeper analysis, users can sign up for our Crypto Alpha Newsletter to receive weekly deep-dives into emerging trends. This combined approach ensures you have the data needed to interpret volatility without the cost of institutional terminals.
What is the difference between market cap and price change?
Price change measures the percentage shift in an asset's individual unit value over a specific period. Market cap represents the total dollar value of all coins in circulation, calculated by multiplying the current price by the circulating supply. While a major cryptocurrency price changes the asset's unit value, the market cap determines its ranking and overall dominance. Understanding this distinction is vital for contextualizing the scale of a rally within the $2.63 trillion global market.
How does trading volume affect cryptocurrency price changes?
Trading volume serves as a confirmation tool for price sustainability. High volume during a price surge indicates strong institutional interest and suggests the new price level has a solid foundation. Conversely, price shifts on low volume are often the result of "wash trading" or retail speculation, making them prone to immediate reversals. Volume data helps you distinguish between structural market shifts and temporary noise, providing a clearer picture of where capital is actually flowing.
Can institutional news cause immediate price volatility in 2026?
Yes, institutional news is now the primary driver of volatility in the Top 20. The upcoming Senate vote on the CLARITY Act is a perfect example of a catalyst that can trigger immediate price swings. Announcements regarding spot ETF inflows or central bank policy shifts cause institutional desks to rebalance their portfolios instantly. These professional moves lead to large-scale buy or sell orders that penetrate market depth, resulting in the rapid price shifts seen throughout the year.


